

How well do you and I understand Covid-19?
Especially in today’s onslaught of information, it’s critical to be able to see more content at a glance — and to understand the information quickly and correctly.
We’ve seen the value of a single graphic with the famous Covid-19 World Map. We’ve understood quickly with directional graphs for Covid-19’s growth curves. And we’ve experienced how the “take one person out of the spread and see how the spread slows” graphics can change our own behavior.
These critical visuals help us to understand huge amounts of information quickly.
Take a look at the US map below.
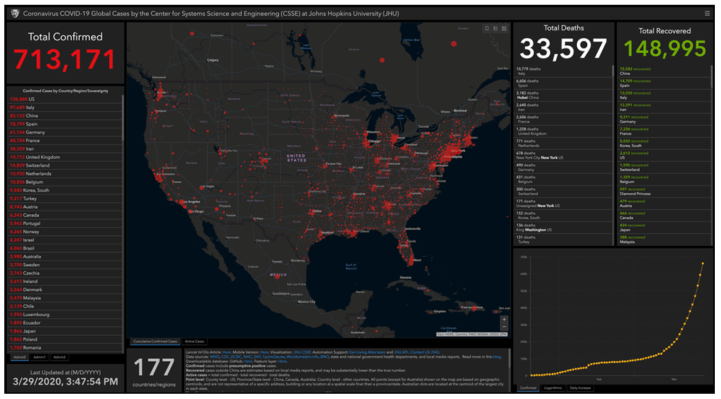
The closeup of the US map above doesn’t look like much, maybe… because in this particular view, there’s a whole lot of “black” to that red.
But those red dots can take on more meaning when you look at this graphic:

Here are the World Map’s numbers right now.
Look at the difference between this and yesterday’s map (above). How much growth happened in less than 24 hours?

Yesterday was 713, 171. Now it’s 745,308. And no doubt it’s higher, if you go and check the map here right now.
What happens to information’s impact if you add video?
This little video graphic put social distancing into perspective for many of us:

And for Americans, this video graphic packs a double punch to the gut.
A graphic can carry the emphasis that we need, to communicate clearly and with strength.
And because we have so much information to consume, this “graphicacy” — the ability to create, read, and communicate large amounts of information in simple, clear graphics and visuals — is critical.
“How’s your graphicacy?”
We don’t read articles. We read headlines. We skim. And we look for social media posts to condense critical content into something simple for us to “get quickly” (to “make it easy”).
The problem is, posts carry incredible bias and a whole lot of misinformation.

Primary, straight-from-the-horse’s-mouth sources are critical.
Because this “secondary source” thing, along with here-say, personal bias, and confirmation dynamics, can be the death of us. And when we’re talking about Covid-10, that’s not just a saying.
More than ever, it’s critical to use graphics that get information across quickly and clearly.
Clear graphics help us to get first-hand, correct information fast.
Personally, I believe we’re in the age where graphicacy should be taught equally alongside written, verbal, and emotional literacy — because in our world culture, information sharing and the sheer amount of information we need to grasp will only grow.
You want to understand solid information quickly? Read reliable graphs and infographics based on primary data.
You want to make information count? Create reliable graphs and infographics based on primary data.
Don’t let someone else’s ideas and social media posts be your Covid-19 end-all.
Here’s a phenomenal super-short Ted Talk on graphicacy to watch
while you’re social distancing.
Stay safe,
Erin
PS. Here’s Henri, one of my social distancing buddies
and official foot warmer while working. I hope you
and your family stay well.

Erin M. Brown, MA, MFA (author Erin Brown Conroy/EB Conroy), is a professional writer/author/editor with a BM in education, an MA in a health field, an MFA in writing. She’s been creating, coaching, and speaking nationally and internationally on writing, communication, and more for over 20 years. She’s also the author of nine books; thousands of articles, marketing content and pages, and web pieces; multiple courses and curricula on writing, reading, leadership, and communication; and over 70 online courses (including how-to writing courses) used across the world. A former university professor of writing, research, leadership and management, and interpersonal communication, she’s currently the lead brand and UX creative and content writer for a worldwide online education company. Erin lives in and writes from Michigan, USA.
